#6 Visualising Fifty Years of Terrorist Violence in Israel and Palestine
I used a database of all recorded terrorist attacks in Israel and Palestine between 1970 and 2020
The Hamas attacks on October 7th have been the most deadly terrorist attacks in Israel in decades. The Global Terrorism Database based at the University of Maryland collects data on all acts of terrorist violence around the world since 1970. For each act of terrorism, a number of variables are coded, such as the (alleged) perpetrator, the number of people killed or wounded, the geographical location, and a brief summary of the event.

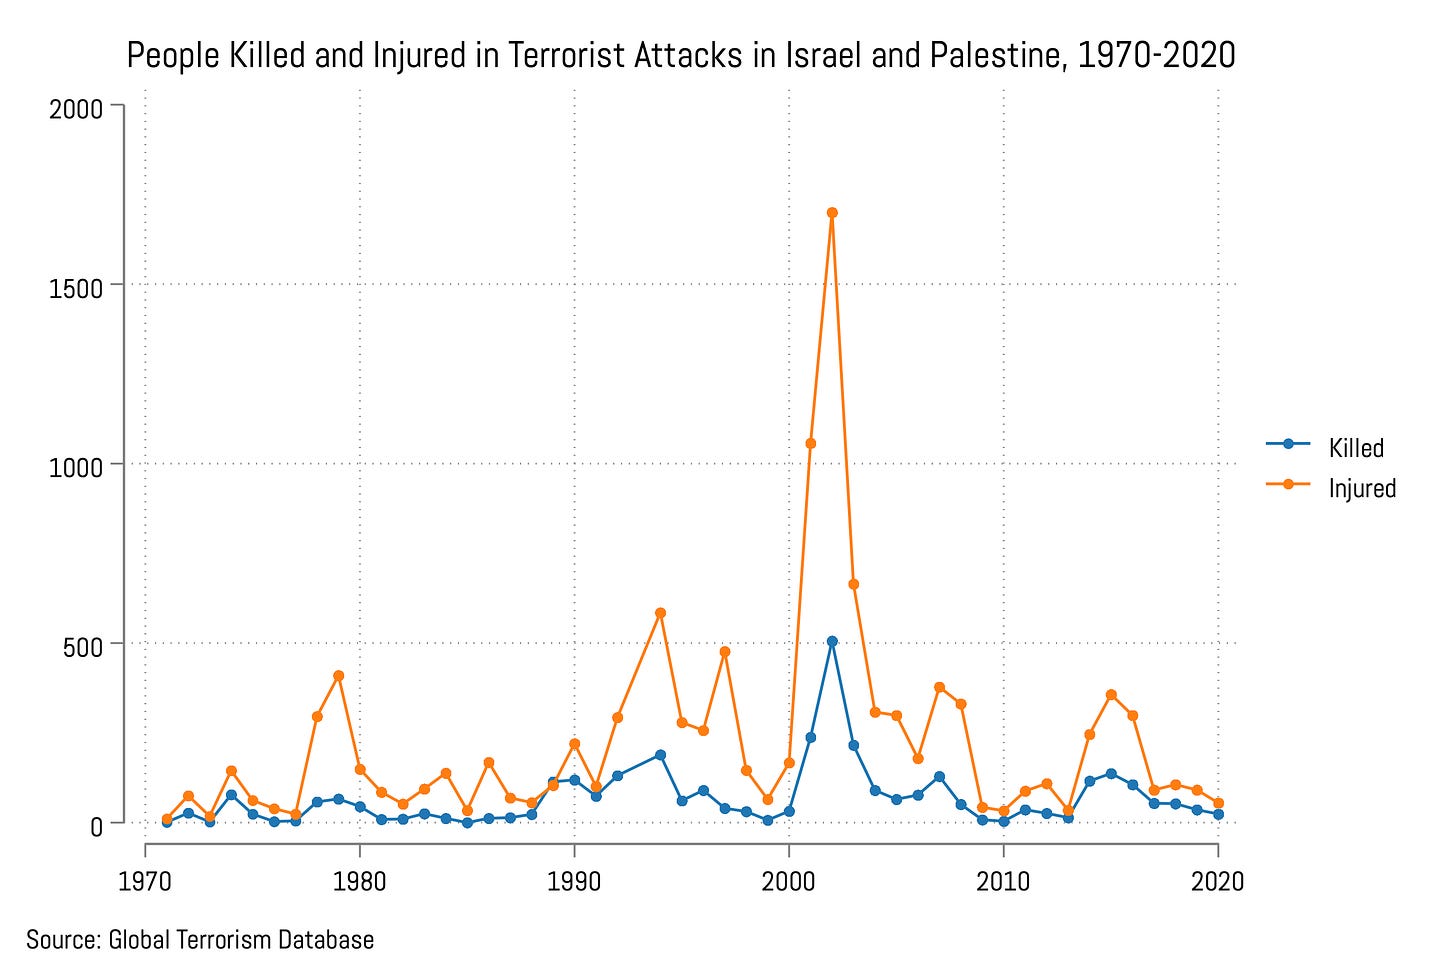
The database makes it possible to visualize the number of victims of terrorist violence each year. The graph above shows the number of people killed and wounded in Israel and the Occupied Territories since 1970 (it excludes therefore acts of terrorism committed elsewhere by pro-Palestinian groups, such as the 1971 Munich Olympics attacks). The data makes it possible to retrace the history of the conflict and understand the different spikes in violence.
There is an interesting pattern where increases in terrorist violence tend to respond to or cause initiatives to settle the conflict at the political level. After the first Intifada, the period that followed the signing of the Oslo accords in 1993 was followed by an increase in violence during which radicals on both sides tried to undermine the peace process. For instance, Yitzhak Rabin was killed in 1995 by a far-right Israeli extremist, and Hamas gained strength during that period, mounting an insurgency to challenge Fatah’s cooperation with Israel.
The post-2000 period (Second Intifada) was the most deadly period until the attacks last month, and it followed the failure of the Camp David Summit. However, the Second Intifada was also followed by the withdrawal from Gaza, the delegation of (some) power to the Palestinian authority, and a subsequent decrease in terrorist deaths.
Before the recent October 7th attacks, Israel had also started a process of diplomatic rapprochement with a number of Arab states in the region, and one possible driver of the October 7th attacks was to undermine that process by making it impossible for these states to talk to Israel if it retaliated massively against Gaza.
Because the data is geocoded, it can be used to make maps. I have used this data to make an interactive one of all the recorded terrorist attacks in Israel and Palestine in the database, with a brief summary of the event in question (when you hover over each point). The height of each bar is the number of people killed, and gives a sense of the location of violence over time. I can also be accessed here. For details on the source data, please check the GTD.


